For the app itself, see https://micahtillman.com/lsviz
See also the app info page and the v. 2 release notes.
What are “nodes”?
Each figure consists of line segments. The beginning and end of each line segment is a node. If the app is set to draw dots, it will place a dot at each node.
What does “Draw _____ node(s) at a time” mean?
This app draws figures one “frame” at a time, like a movie or video game. This setting tells the app how many line segments or dots to draw to the screen in each of those frames.
If we ask the app to draw too many nodes at once, the app may take too long to complete its calculations. And that may space the “frames” out, making the app appear to freeze and then jump forward, then freeze, then jump forward.
On the other hand, if we ask the app to draw only a few nodes at once, the app will run very smoothly. But so few line segments or dots will be added to the screen each time, that it will feel slow.
What does “Scaled” mean?
With each iteration, the app has more dots and/or line segments to draw. So, completing the figure for later iterations will take longer if we keep drawing the same number of dots or line segments (“nodes”) to the screen during each frame.
The “scaled” option tells the app to increase the number of nodes it draws to the screen during each frame as the number of iterations increases. This will hopefully help keep the speed of drawing up.
Of course, having to draw too much during a single frame will slow things down too. So, the app is set to monitor its frame rate and then cut back on how much it’s trying to draw if things slow down too much.
What does “colors show interpolation” or “accretion” mean?
As the app moves from iteration to iteration, the figure it is drawing has more and more nodes (line segments and dots). But which ones should we count as having been already there, and which ones should we count as being the new ones?
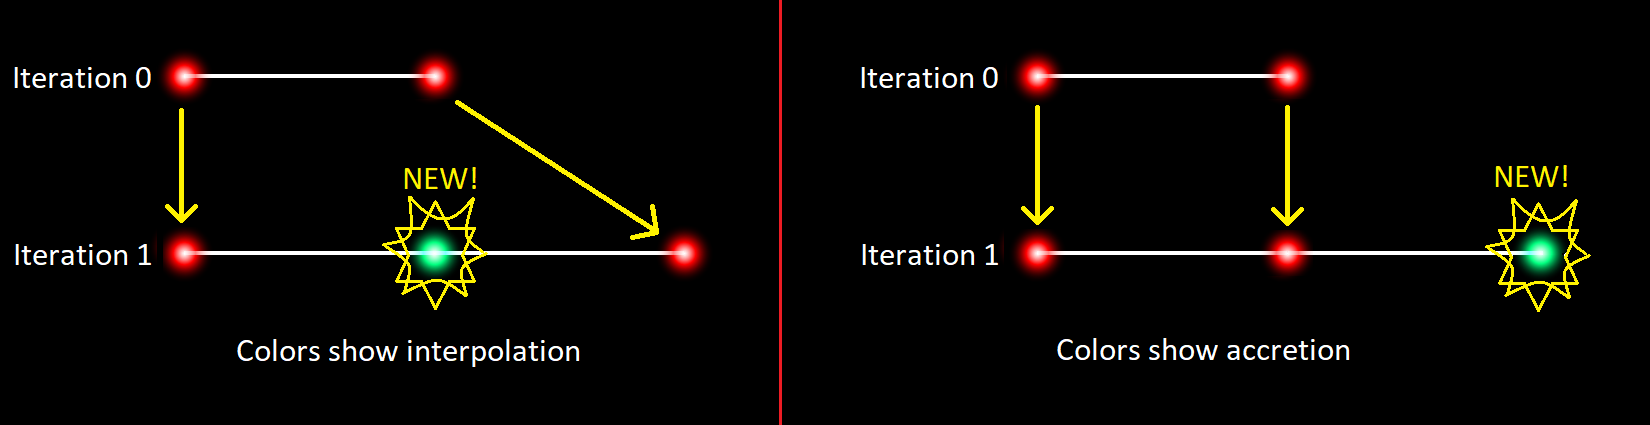
In the image above, we see the two possible interpretations. Every figure is a continuous series of line segments, connected end-to-end. So, either a figure grows by appending new line segments to its end, or by inserting new line segments into its middle.
If we think of the figure as growing from within (interpolating new nodes between the old ones) — and if we want the color of each dot to represent the iteration during which it was introduced into the figure — then new colors will show up between the colors that are already there as we move from iteration to iteration.
If, instead, we think of the figure as growing by appending new line segments to its end, we would expect new colors to show up next to/beyond where we see the previous colors (as we move from iteration to iteration).
The default way of understanding the issue, for the purposes of this app, is to think of new dots as being inserted into the previous iteration’s line segments. This way of thinking about the growth of a figure comes from:
- the Dragon Curve, which derives from “paper folding.” In that process, new folds are inserted in between the folds that were already there. Those folds are nodes in the Dragon Curve. They are ends of line segments.
- the idea of replacement rules.
When the L-system cycles through the various letters in a string of symbols, replacing each with its own set of substitute symbols, we are effectively inserting new symbols into the original string. And thus we are inserting new instructions for drawing, and thus new line segments and dots, into the figure.
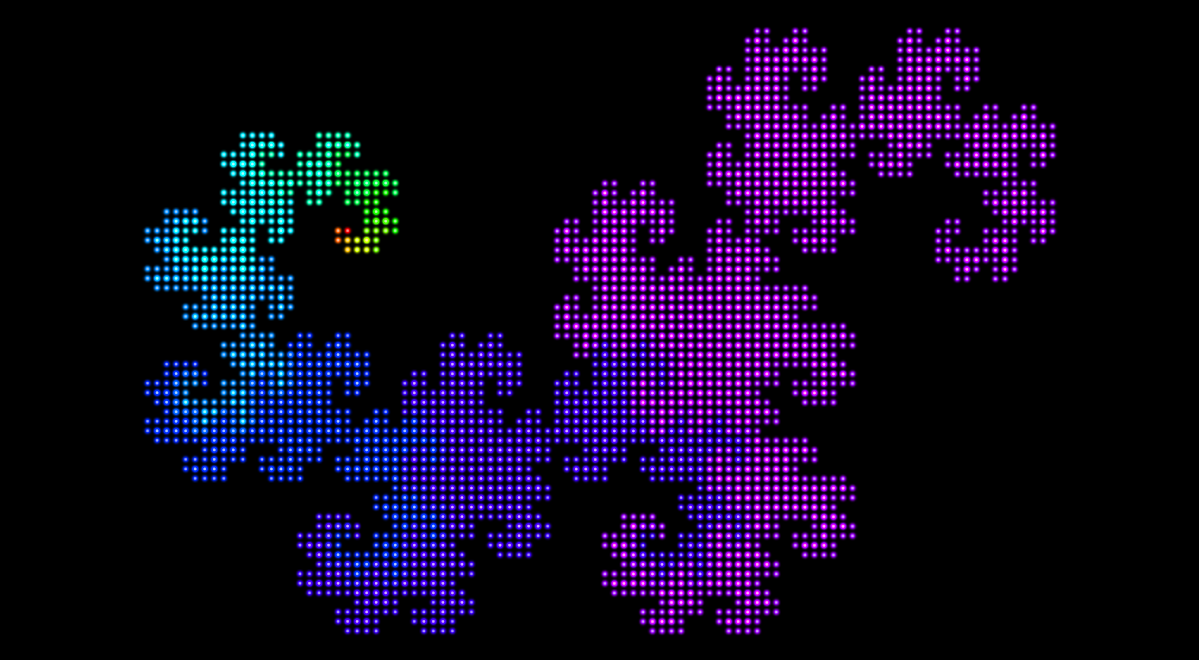
When “colors show accretion” is turned on, you can get results like this:
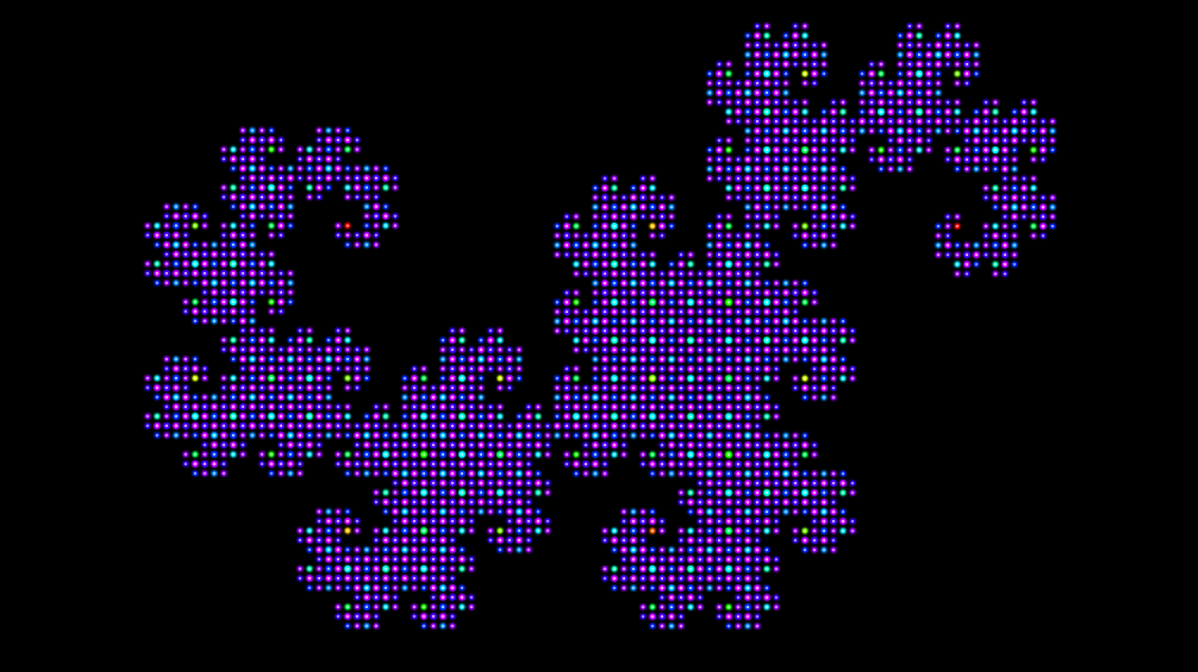
When “colors show interpolation” is turned on, however, you get results like this:
Why does “colors show accretion” not work with some figures?
It only makes sense to see new iterations of a figure as appending new line segments to the end of the figure created by the previous iteration if each iteration of the figure includes the previous iteration’s version of the figure.
This is true of many fractals. No matter how many iterations you run, the beginning of the Dragon Curve is always the same. If I’m doing this correctly, here are the first few iterations of the string of symbols produced by the Dragon Curve’s L-system:
- F
- FlG
- FlGlFrG
- FlGlFrGlFlGrFrG
Each iteration is identical to previous plus more stuff added to the end.
Now, contrast that with the first two iterations of the L-system the app uses to generate the Koch Snowflake:
- FllFllF
- FrFllFrFllFrFllFrFllFrFllFrF
The sequence “FllFllF” only shows up once, and future iterations begin differently.
Now, one of the cool things about fractals is that they usually contain smaller copies of themselves, visually speaking. But the app doesn’t know how things look. All it can do is compare the strings of symbols generated by a given L-system, and ask how much overlap there is between them.
That being said, I have programmed the app to recognize L-systems whose strings of symbols do not start identically, but whose strings always produce the same sequence of moves and turns. But if the set of moves and turns with which each iteration begins (including the starting seed) is not identical with the entirety of the previous iteration’s moves and turns, the app will default to having the colors of dots show interpolation.
What does “Random Fractal” mean?
The app has a library of over 200 fractals and fractal variants. Clicking the “RANDOM FRACTAL” button will select one of those fractals at random and then display it for you.
Where are the L-systems and fractals in the app’s library from?
Some are from Wikipedia (see, e.g., this page, and the pages for the individual fractals).
The new, more efficient version of the L-system for the Dragon Curve is from this page, created by Joel Castellanos at the University of New Mexico.
The rest were found using v. 1 of the app. Most were found by me, but the 30-degree Squaradise and 40-degree Triangle Paradise fractals were found by a friend using the app.
I don’t know how many — if any — of the fractals/L-systems in the app’s library are original. That is, I don’t know how many of them were “first time in history discoveries.”
Can I submit the fractals I find for inclusion in the app’s library?
Sure! Just use the contact form to send me the URL of the fractal you found (the app generates a URL for each L-system you have it draw; just copy and paste that URL). Or @ me on Twitter (where I am @micahtillman).